Using linear regression to predict desktop computer prices
The third week of Metis is over, and with it, project two has been completed. This project was much more free form in that the only constraints imposed on me were the expectation that I would collect all my data via web scraping and predict something using linear regression. Everything else was on me, including subject matter, methodology, and tech stack used.
I had the most trouble with project brainstorming – my initial ideas included predicting the price of a stock based on a few performance indicators, predicting the price of flights based on distance, flight time, etc., and a few other ideas. Stocks were no good because there’s not really a scenario where you know all its performance indicators and don’t know its price. Flights were difficult because websites like expedia.com are full of dynamic javascript pages that make scraping much more difficult.
Finally, I settled on predicting the price of desktop computers based on their components. This was the perfect project for me because I’ve built a few desktop computers and picked up a little domain expertise along the way, and this project has a clear business use case (helping computer retailers price their products) which is one of the requirements I had set for myself.
Scraping
I used the Python library BeautifulSoup4 to scrape newegg.com. This wasn’t a simple process. Newegg is not very scraper-friendly in the sense that they only allow you to make around 1,500 requests to their page each day. This meant I had to either change my IP address or wait a day to begin scraping again. Still, I persisted and after a few days (and late nights) I managed to get price and component data on 4,600 desktop computers. Ensuring each price corresponded to the correct components was a great exercise in database design for me. I initially didn’t have a way to match up a price to the appropriate components, and immediately realized why it was so important to have a primary key to join tables (or Pandas dataframes) on. I ended up reverse engineering the way newegg generates the price and component web page urls and used that as my primary key to join prices to components. This was the crux of the project for me – seeing all my data in one table was incredibly relieving.

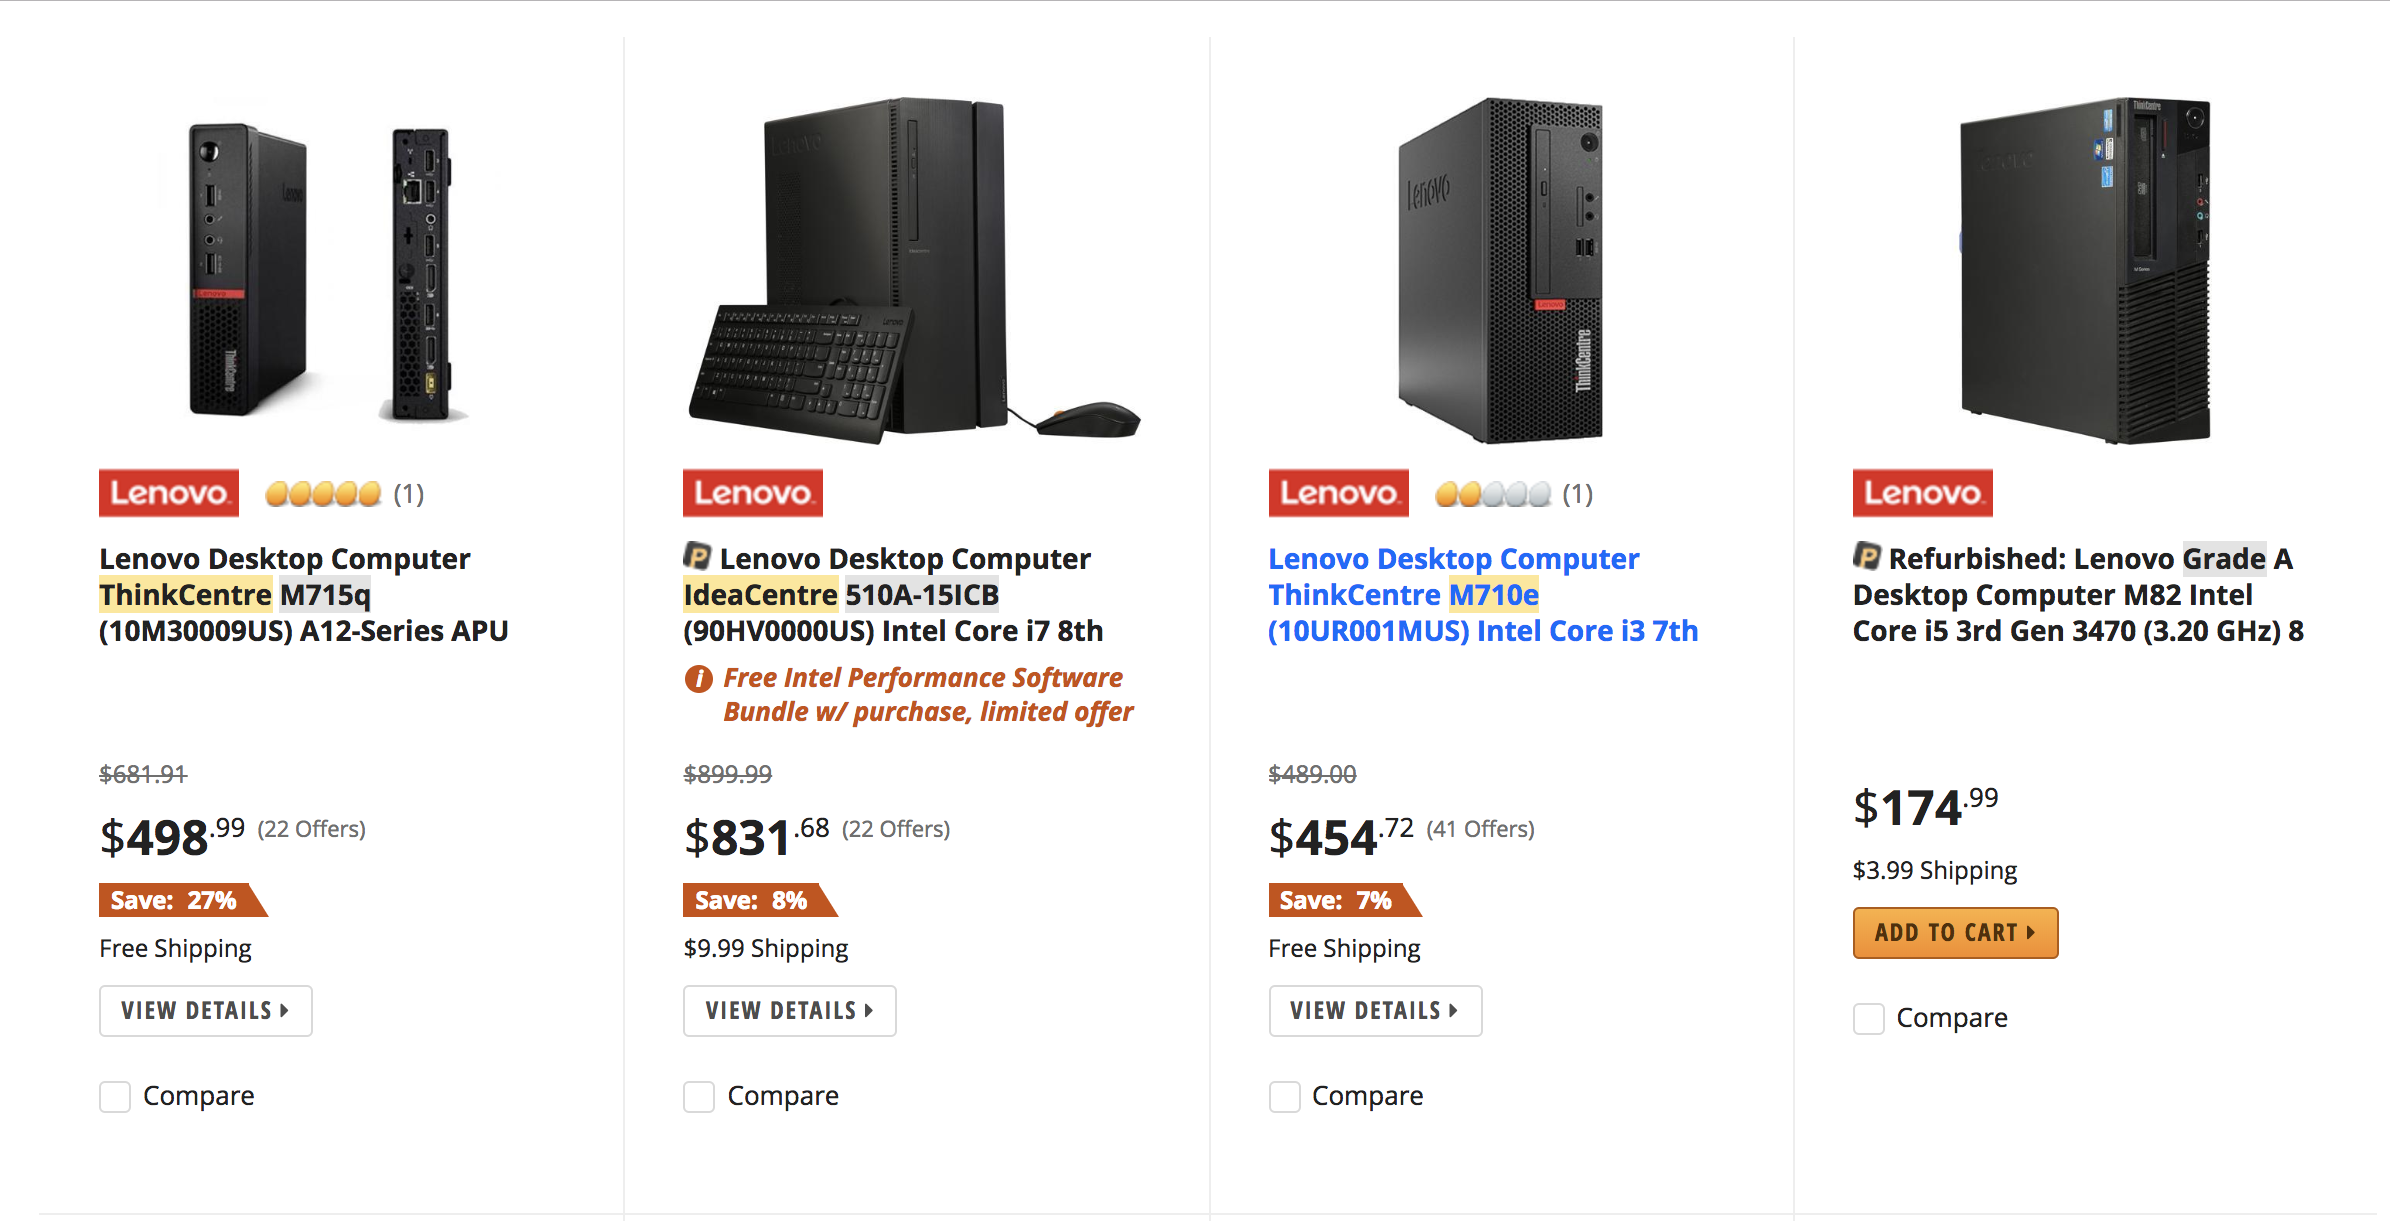
Prices were collected from a page similar to this.

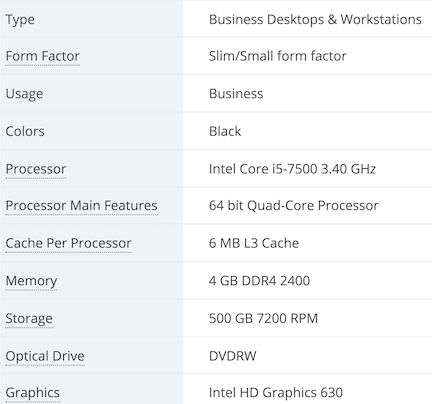
Component data was collected from a page similar to this.
Cleaning
The computer component data in its raw form is the dirtiest data I’ve ever worked with. There is no standard way to describe a processor on newegg.com. This meant I had to come up with ways to clean entries like “Intel i7 8700k 3.60 GHz 6-core processor” and “6700k 3.40 Ghz” as well as everything in between in the same column. Python’s string methods didn’t cut it here – I needed the power of regular expressions. The data I scraped had many inconsistencies, meaning some pages had all the technical specifications I could ever want and some pages had almost nothing. This meant that I had a total of 81 unique variables, but most of these variables only had a few hundred non-null values in them. I had to drop most of these variables from my analysis, as well as most of the desktops I had data on. After carefully imputing values for a few of my variables, I was left with 1700 desktop observations I could feel good about.
Modeling
Previous to this project, I had submitted an entry or fifteen to Kaggle’s Titanic competition, but that was the sum total of my machine learning / regression experience. I didn’t really understand the workflow of creating a model, and so spent a lot of time not knowing what I should do next or what was absolutely critical and what was “nice to have” in a model. With help from my instructors, I was able to make my way through the process of building a linear regression model I’m proud of.
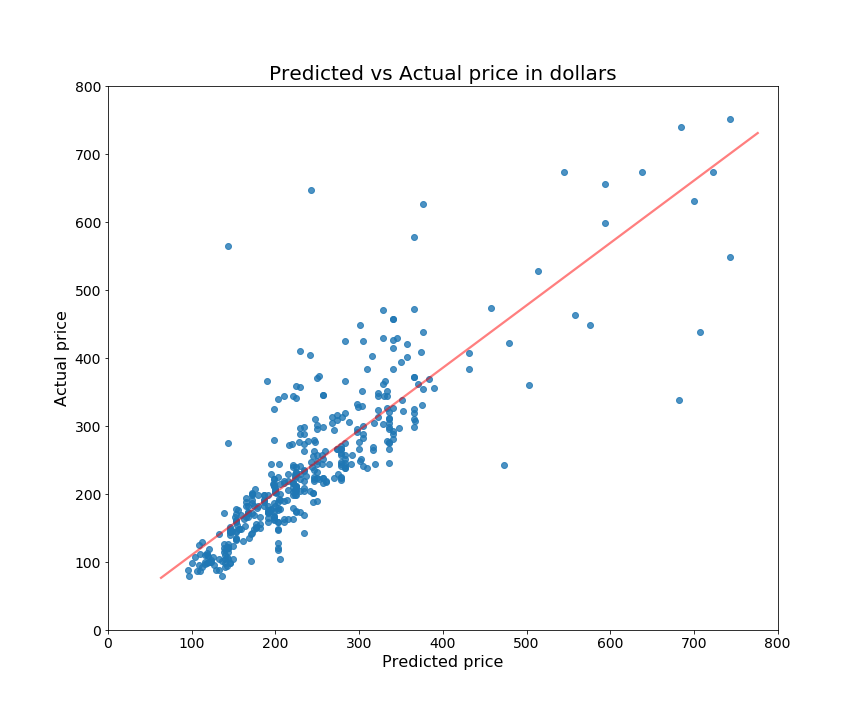
I ended up using an ordinary least squares (OLS) model with 10-fold cross validation. I wanted to see if regularization was helpful for my model, so I tested Ridge, Lasso, and Elastic Net regressions, but didn’t find any improvement over vanilla OLS. Because I wasn’t using regularization, I was concerned my model would overfit my training data and perform horribly in the real world, so I kept a close eye on the difference between my training and testing mean squared error. My final model had a test-train difference in MSE of only about 300 – 3600 MSE for training and 3882 MSE for testing. My R^2 was .75 for training data and .74 for testing data.

My model utilizes scikit-learn’s StandardScaler function, which scales all my variables in to the same order of magnitude. This was important, for example, because the number of cores in a processor might be 2 or 4, while the number of gigabytes in a hard drive might be 1,000 or 2,000. The OLS solver has a tough time when there’s such a large difference in the distribution of variables, so scaling was helpful in my case.
Feature engineering was far and away the most important way I improved my model’s predictive power. Many variables in my dataset had a non-linear relationship with price. A 1,000 GB solid state drive (SSD) is going to increase the cost of a computer much more than a 1,000 GB hard disk drive (HDD). In this case, I made price scale quadratically with SSD capacity and linearly with HDD capacity. This helped my model more accurately predict a computer’s price when based on its storage type and capacity.
What I learned
My model isn’t perfect. The residuals are not quite homoscedastic, and there are some relationships between price and components that aren’t totally captured, but I am proud of my model. I also think the web scraping skills I gained in this project have opened up endless possibilites for me in my ability to collect data. I’m still getting comfortable with Python’s scikit-learn library, but I know familiarity with this library is bound to come through the next 9 weeks at Metis.
As for now, I’m going to take a light Sunday while I have the opportunity, maybe do a little brainstorming for project 3 (apparently it’s a classification problem – send me datasets if you have any good ideas!), and prepare for week 4!
