The best NYC subway stations to canvas
I just finished my first week of the Metis data science bootcamp. About eighteen hours ago my group and I were presenting our first project, wherein we were tasked with recommending the optimal New York City (NYC) subway stations to canvas for an upcoming Gala supporting women in tech.
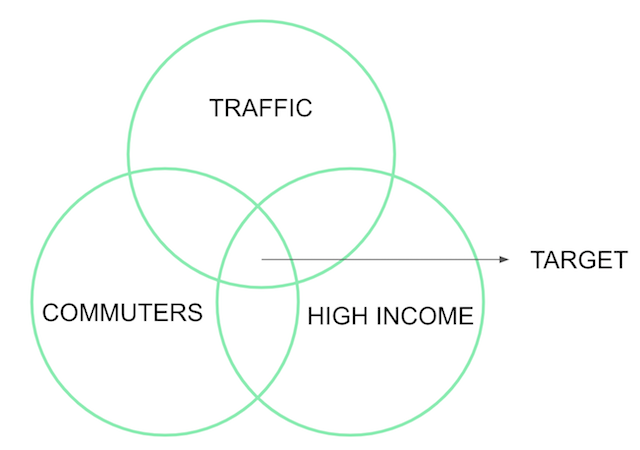
Our first thoughts were to find the subway stations closest to tech companies with a high percentage of women working at them, to generate a heat map using a Python module called Folium, to find data about which subway stations have the most generous riders. Then we realized we had three and a half days to complete this project. Tempering our expectations, we decided to choose our stations on three simpler criteria:
- How wealthy the area surrounding a subway station is
- Whether a station is a commuter station or a tourist station
- The median daily traffic of a station

Classifying the wealth of a station
After sifting through some lengthy JSON objects courtesy of the Google Maps API and utilizing our collective Google-fu to find NYC income data by zipcode, we had data on how many people fell in to each tax bracket within the zipcode of each station. The mathematician in me wanted to create a fancy “income score” wherein each tax bracket was weighted differently, but, being stretched for time, the pragmatist in me won out – we went with a simple count of high income people in each zipcode. Next we had to decide how to use this metric to classify a station as “high income” or not. To do this we started at one standard deviation above the median number of high income people, and moved up and down from there to gauge the sensitivity of how many stations met or did not meet this criteria as we changed it. Our final income filter required that a station have eight thousand or more high income residents living nearby, which cuts out seventy nine percent of stations.
Determining if a station is trafficked by commuters or tourists
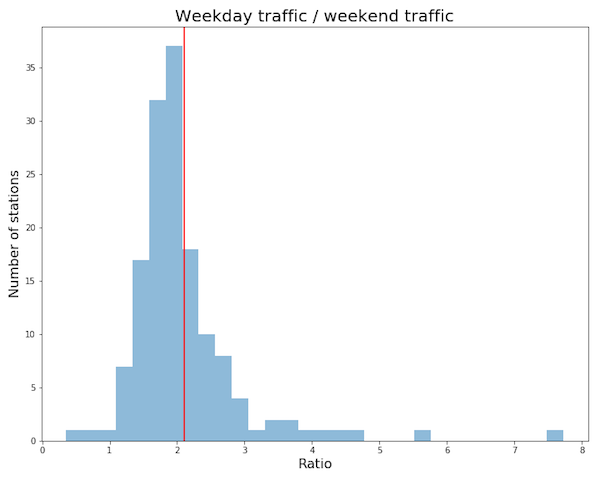
The Mass Transit Authority (MTA) of New York provides down-to-the-turnstile data every four hours. If you’re reading this post close to an hour that’s a multiple of four, each subway turnstile in NYC is about to faithfully report its most recent traffic to the MTA. It’s this granularity that allowed us to distinguish between weekday traffic and weekend traffic, the idea being that if a station has busier days on the weekend then it’s not a commuter station. With this in mind, we added up each station’s daily traffic on weekdays and weekend days, took the median of each, and looked at how the two compared. Specifically, we were looking for stations which had more than twice the median daily weekday traffic when compared to the weekend. This eliminated about sixty five percent of the stations in our dataset.
Below you’ll see a histogram of all the stations in our dataset. We only considered stations to the right of the red line as potential selections.

Median daily traffic of a station
When it comes down to it, canvassing is a numbers game. Filtering for stations that have high ridership – whether those riders are rich or poor, commuters or tourists – it’s important to reach a lot of people. We found the median daily traffic of a station, looked at one standard deviation above the median, and gauged how many stations are excluded by increasing or decreasing our median daily traffic criterion. We ended up choosing fifty thousand daily riders as our cutoff, which excludes eighty five percent of stations.
Bringing it all together
Finally it was time to find the unicorn stations that met all our criteria. After cutting out any station that didn’t have the three following properties:
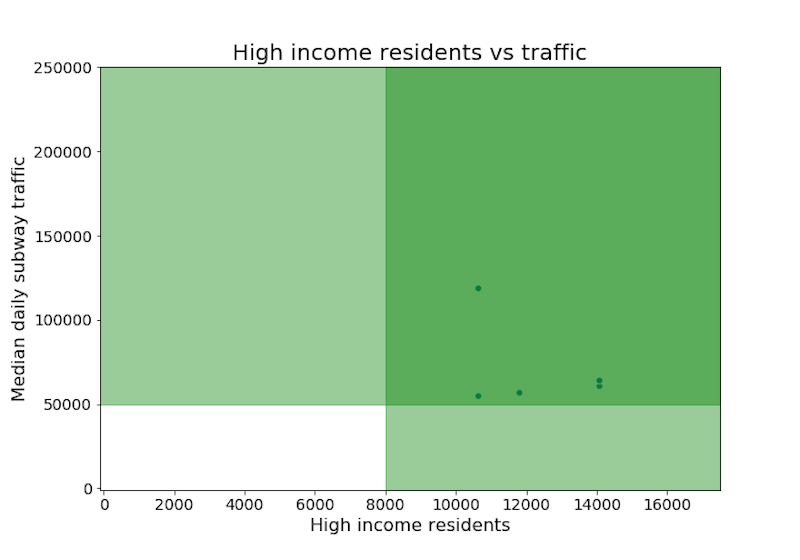
- More than fifty thousand daily passengers
- Two times as much weekday traffic as weekend traffic
- More than eight thousand high income people in the same zipcode as the station

The five dots in this scatter plot each represent a station meeting our golden requirements.
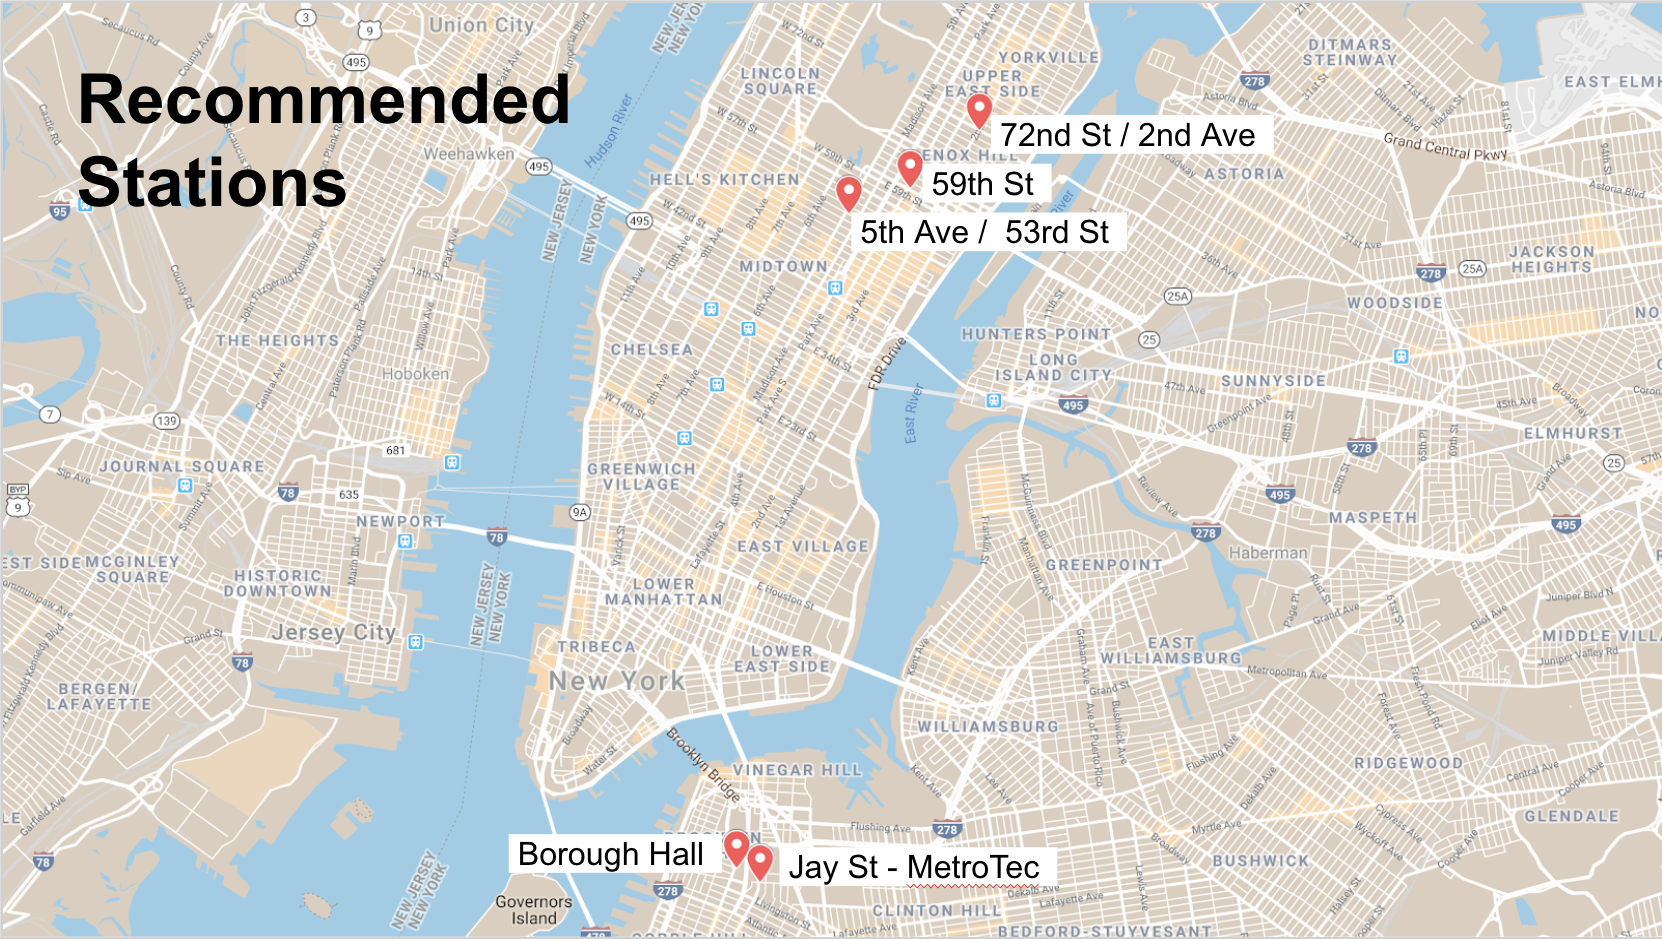
These are the five stations:
- 72nd Street and 2nd Avenue
- 59th Street
- 5th Avenue and 53rd Street
- Borough Hall
- Jay Street Metrotec

Three of our stations are in upper Manhattan, and two of them are in Brooklyn.
With our shortlist of stations in hand, we ran some analysis on how traffic changes throughout the day at each of these stations, and found the best times to station canvassers at these stations was Tuesday, Wednesday, and Thursday between 9 AM and 6 PM.
Tools
This project a blast! It was a huge amount of work to complete in only three and a half days, but it all came together in the end. I had never used the Google Maps API before, but now I feel confident in my ability to find the geocodes of any location using it. This project was also a great exercise in Matplotlib. I felt fairly comfortable with it going in, but I learned a few new tricks along the way that will be very useful in future EDA.
